Cartesian Graph Paper Generator
Create printable Cartesian coordinate graph paper online. Customize the paper size, grid spacing, axis labels, numbers, colors, and line thickness, then print or save your graph paper as a PDF.
Graph Settings
Live Preview
Tip: The “Download as PDF” button opens your browser print dialog. Choose “Save as PDF” as the destination.
The Cartesian plane plays a fundamental role in Mathematics and many scientific disciplines. It is a two-dimensional coordinate system formed by the intersection of the horizontal x-axis and the vertical y-axis at a point called the origin. This system allows users to identify the exact position of points using ordered pairs and helps visualize relationships between numerical values and geometric shapes.
Traditionally, students, teachers, engineers, and professionals relied on printed Cartesian graph papers or manually created grids in spreadsheet applications to plot points and draw graphs. However, with advances in technology, creating customized graph paper has become much easier through online tools.
What is a Cartesian Graph Paper Generator?
A Cartesian Graph Paper Generator is an online tool that allows users to instantly create customized Cartesian coordinate grids directly from their web browser. Instead of searching for pre-designed worksheets with fixed layouts, users can generate graph paper according to their specific requirements.
The generator typically includes options to customize grid size, paper orientation, axis labels, numbering styles, line thickness, colors, and the number of units displayed on both the x-axis and y-axis. Once the desired settings are selected, the graph paper is generated automatically and can be printed or downloaded for immediate use.
This modern approach provides greater flexibility compared to traditional graph paper while saving valuable time.
What Does the Cartesian Graph Paper Generator Do?
The generator simplifies the process of creating accurate Cartesian coordinate grids for educational and professional purposes. Users can design graph paper tailored to their exact needs without requiring advanced software knowledge.
The generated graph paper enables users to:
- Plot ordered pairs accurately.
- Visualize mathematical relationships.
- Draw geometric figures.
- Practice coordinate geometry concepts.
- Solve algebraic problems involving graphs.
- Create customized worksheets for classroom activities.
- Produce professional-quality graph paper for presentations and reports.
Because the graph is generated dynamically, users can quickly adjust settings whenever different graph layouts are required.
Understanding the Cartesian Coordinate Plane
The Cartesian coordinate plane uses two perpendicular number lines:
- X-axis: The horizontal axis representing the first coordinate of an ordered pair.
- Y-axis: The vertical axis representing the second coordinate.
The point where these axes intersect is known as the origin (0, 0).
When plotting points:
- Positive x-values move to the right.
- Negative x-values move to the left.
- Positive y-values move upward.
- Negative y-values move downward.
The correct order of coordinates is extremely important because the pair (x, y) represents a completely different point than (y, x).
Benefits of Using an Online Generator
Using an online Cartesian Graph Paper Generator offers several advantages over manually drawing grids or creating them in spreadsheet applications:
- Saves time by instantly generating graph paper.
- Allows complete customization of graph settings.
- Produces neat and accurate coordinate grids.
- Eliminates the need for specialized software.
- Works directly from a computer, tablet, or mobile device.
- Supports printing and downloading for offline use.
- Helps educators create differentiated learning materials.
These features make the generator particularly useful for teachers preparing classroom activities and students practicing graphing concepts independently.
Applications of Cartesian Graph Paper
Cartesian graphs are used in many academic and professional fields, including:
- Mathematics education
- Coordinate geometry
- Algebra
- Calculus
- Engineering
- Physics
- Astronomy
- Computer graphics
- Architectural planning
- Technical drawing
The Cartesian coordinate system has played an essential role in the development of modern mathematics since its introduction in the seventeenth century. In calculus, for example, graphs help determine slopes of curves, analyze functions, and calculate areas under curves.
Online Generator and Traditional Templates
Our Cartesian Graph Paper Generator provides a quick and convenient way to create customized graph paper online. Users simply choose their preferred settings, generate the graph, and then print or download it for immediate use.
For those who prefer traditional editable documents, we also continue to offer our Cartesian Graph Paper worksheets for Microsoft Word users. These downloadable templates can be edited manually and are ideal for individuals who need a reusable offline format.
Whether you choose the interactive online generator or the classic MS Word worksheets, both options are designed to support learning, teaching, and professional applications involving the Cartesian coordinate system.
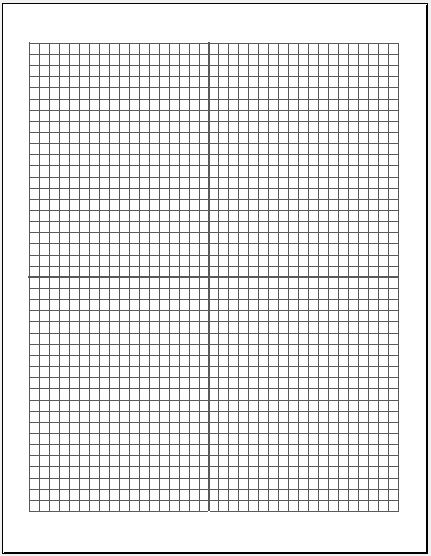
Cartesian Graph Papers -small, medium & large boxes on 8.5" x 11" letter size printing paper in RED.
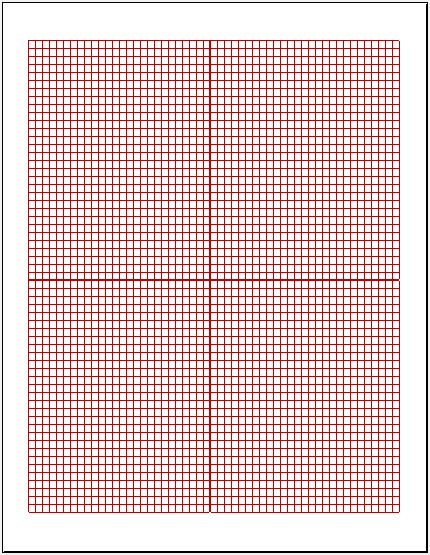
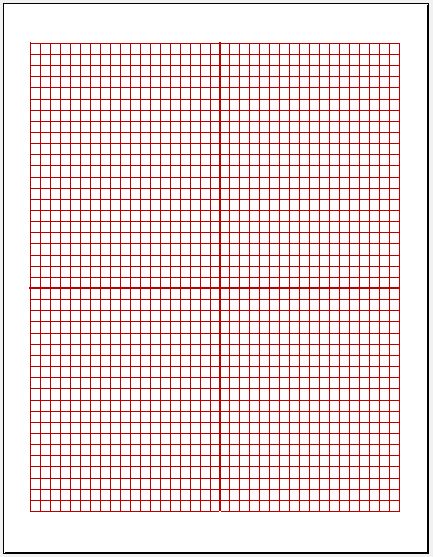
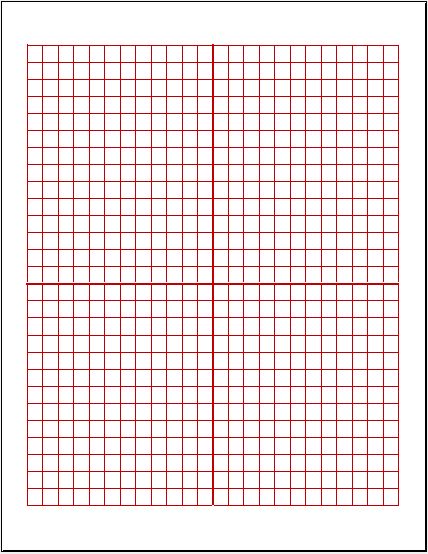
Format: MS Excel 2003/+
Cartesian Graph Papers -small, medium & large boxes on 8.5" x 11" letter size printing paper in BLACK.
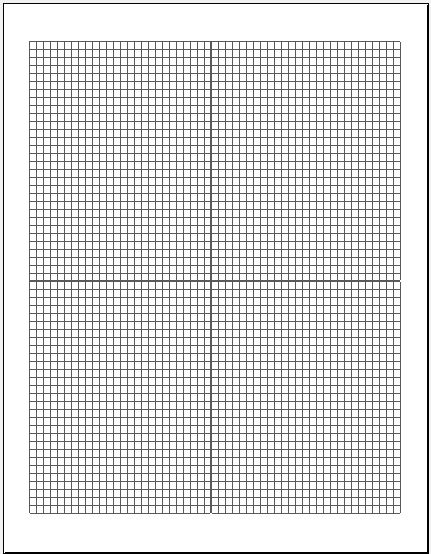
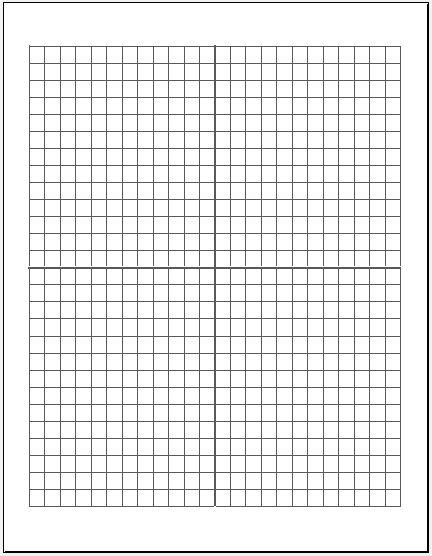
Format: MS Excel 2003/+
- Quotation Register
- Customer Order Tracker
- Inventory Dashboard Generator
- Sales Dashboard Generator
- SWOT Analysis Generator
- KPI Scorecard Generator
- Warehouse Bin Location Generator
- Dispatch Slip Generator
- Office Asset Transfer Form Generator
- Summer Holiday Assignment Cover Page Generator
- Salary and Overtime Calculator Template
- Summer Vacation Planner Generator
- Outlet Mall Shopping Planner
- Customer Information and Ranking Sheet
- Small Family Kitchen Design Planning Sheet
- Summer Party Budget Sheet Generator
- Payroll Register & Salary Sheet Generator
- Employee Skill Development Tracker