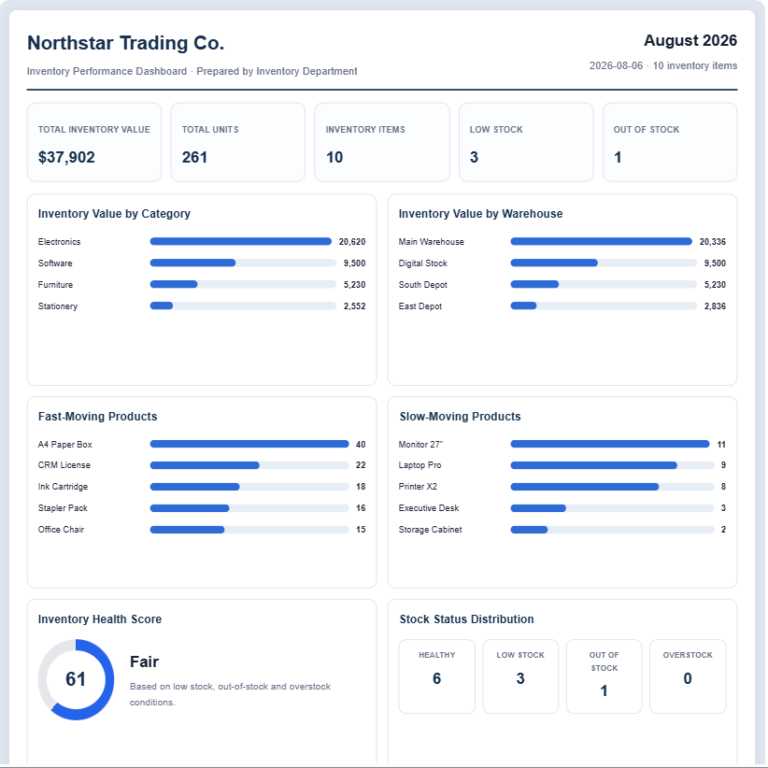
The Sales Dashboard Generator is a practical online tool for reviewing sales performance without complicated business intelligence software. Users can enter individual sales records and instantly convert the information into a visual dashboard containing key performance indicators, charts, rankings and summaries.
Each sales record includes the reporting month, product, category, salesperson, region, quantity and unit price. The dashboard automatically calculates revenue and updates all results whenever information is added or changed. Important figures such as total revenue, sales records, units sold and average sale value are displayed in easy-to-read KPI cards.
The tool also compares monthly revenue, product performance, sales categories, regions and sales team members. Business owners and managers can quickly identify the best-selling product, top salesperson and strongest region. A sales target field calculates the percentage of the target already achieved.
Sample data is included so visitors can explore the dashboard immediately. Users may add or remove sales rows, select their preferred currency, export records as a CSV file and print the complete dashboard in a professional A4 landscape format. On mobile devices, separate Input and Live Dashboard tabs keep the interface compact, while Zoom+, Zoom− and Fit controls make the dashboard easier to review.
This free Sales Dashboard Generator is useful for small businesses, sales managers, retailers, startups and teams that need a clear overview of sales activity.
Sales Dashboard
Enter sales records and generate a live performance dashboard.
Dashboard Settings
Branding & View
Dashboard Filters
Sales Records
| Month | Product | Category | Salesperson | Region | Qty | Unit Price |
|---|