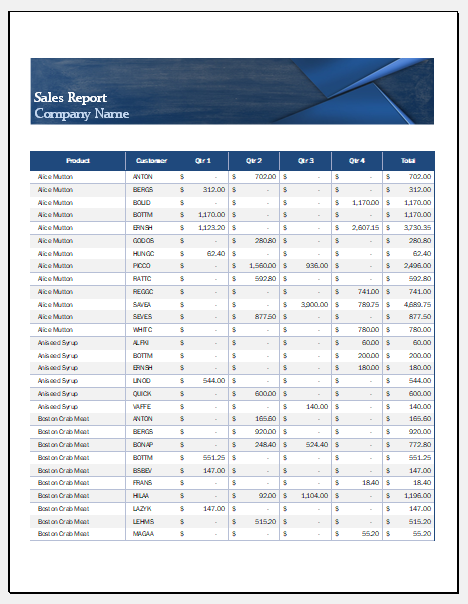
What is a sales report?
A sales report is the evidence of a collection of data gathered over a particular period of time that shows the number of sales performed by a sales team in the form of an organized report. The report is made by the sales department and is submitted to the managers and higher authorities. A sales report includes all the new and existing sales, new and existing accounts, the trends of sales, the volumes of sales, whether increasing or decreasing, the cost of client acquisition, and the revenue gained.
A sales report should be easy to comprehend. It should comprise data in the form of infographics that is concise and understandable.
Importance of sales reports
A sales report is key to the success or failure of an organization. It shows the performance of the organization and helps to evaluate the reasons behind the highs and lows of revenue. It helps in evaluating the performance of employees based on the figures reported, whether they are achieving the desired target or falling behind. A salesperson is accountable to the company based on his sales performance.
A sales team is appraised on a daily, weekly, or monthly basis to measure the productivity of the company. The results thus show whether the company is on track to achieve its set targets and goals. Effective sales reporting ensures the productivity of the organization, more clients, more projects, and consequently more growth toward success.
Weekly Sales Report
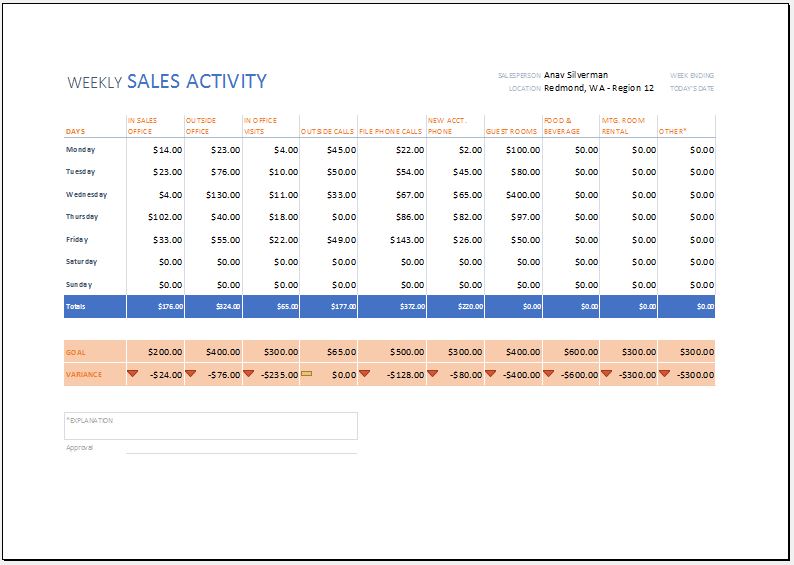
A weekly sales report shows the record of sales performed over the course of a week. The sales team prepares a report on a week-to-week basis, observing their sales trends. This includes the number of sales achieved, the number of new and old clients, the number of clients in the pipeline, and the amount of revenue generated. This enables the organization to assess productivity by the end of the month and also make important decisions in terms of business development, an increase in staff salaries, and recruitment. It should be clear and to the point.
How to write a weekly sales report?
A sales report should present a complete picture of the overall sales the company is experiencing. The sales department is responsible for creating a well-balanced sales report containing figures and graphs that are easy to comprehend for everyone. It should not be complex or overcrowded by data and figures; rather, it should be simple and accurate.
Sales managers should use technology and software to build an effective sales report. CRM is one of the important pieces of software that is robust and helps track, filter, and analyze all the information.
As the sales department is the backbone of a company, the sales managers are expected to deliver the performance of their team to their authorities. The information conveyed in the sales report provides the basis of the company’s major decisions in business growth and development, recruitment, increasing salaries of staff, running expenditure, increasing product, etc. The sales report not only provides an analysis of high sales but is also required to measure the force driving these high sales.
There are certain factors to keep in mind while writing a weekly sales report.
- Audience: A key to formulating a good sales report is to know the audience the sales manager is addressing, and the purpose behind presenting the report. If the report is to be delivered to the chief financial officer, then he would basically be interested in sales figures and revenue generated. Whether enough sales are generated to cover the expenses of the company or not, if the report is given to the sales team, then it would cater to their sales activity, personal and team performance, which product is in demand, whether the sales are meeting the company’s target, and what more efforts the sales team can make to make good pitches and increase their earnings.
In short, the sales report should meet the needs of the audience, and they should be able to extract the data as per their needs.
- Relevant sales metrics: Once the audience is identified, the salesperson should gather the information that is required to present an accurate picture of sales activity and team performance, based on which department will make decisions in favor of the company. Choose specific information like accounts in pipeline versus accounts closed, expenses versus revenue, products selling the most versus products, not in demand, potential areas, challenges, etc.
- Time frame: Decide on a time frame that remains the focus of the report. This ensures accurate and concise data collection and displays to avoid distraction from the main topic.
- Visual displays: Include the right visuals of the display, such as graphics and illustrations, to engage the audience as well as convey the right information. The use of graphs and bar charts makes the data easy to comprehend. Think about the best ways to present your data that would not take time for the audience to absorb. Adding helpful illustrations will make the report more presentable and less confusing. But there should not be an overdose of graphics, the report should be easy to understand, succinct, and practically applicable.
How to write a sales report to your boss?
When you already know the audience of your report is your boss or the top management or CEO of the company, you are aware of the purpose of the report.
Focus on what the boss needs: Collect all the related data and information that the boss demands, so the report is focused and assists in making the best data-driven decisions. Dig out the relevant data as much as possible and organize it well, so you have a background to provide and a ground to play on. Include sales metrics that hold importance, like sales growth over a period of time, acquisition of new clients and closing of old clients, market research on the product, high-selling products, sales revenue over the month or year, target achieved last year, and target accomplished over the current year.
Make it presentable: Prepare a well-presented report that is pleasing to the eye and easy to absorb. The data should be well presented in the form of graphics and illustrations that communicate the figures well. Use a graph to depict sales activity. To provide an overview, opt for dashboards, as they help in visualizing the insights from the data. Dashboards work with real-time data and always present up-to-date information.
Summarize: Provide an executive summary at the end. The summary is key in terms of delivering your point and then giving legitimate findings from your data. As the top management does not have time to go into details, a summary draws major insights, gives a clear picture of the present, and questions the future course of action.
Types of Sales Reports
There are three types of sales reports.
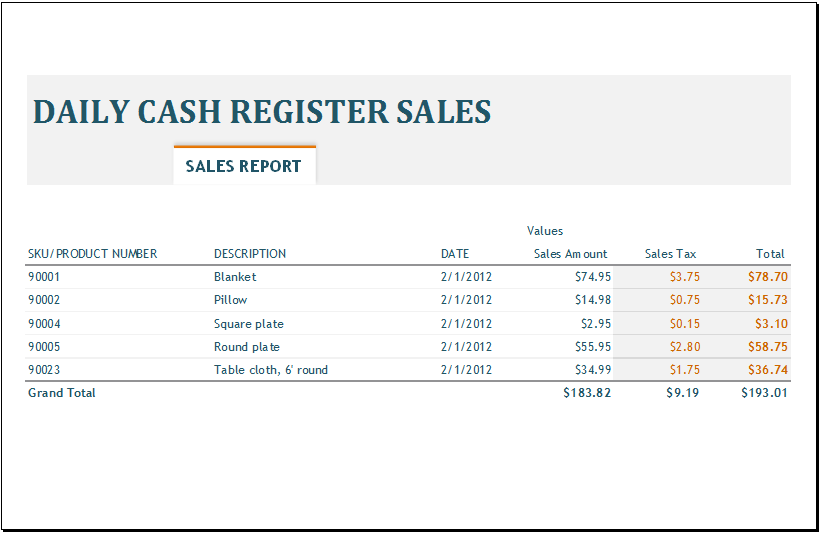
Daily sales report: It contains information about daily progress achieved. The daily sales report considers factors that vary daily and create a difference in the sales, for instance, the number of calls made, talk time, client attained, number of meetings booked, emails sent, and quality of the lead.
Weekly sales report: Reports the sales activity on a weekly basis. It helps in keeping track of the productivity and performance of the company week by week, thus providing the picture until the end of the month without waiting for the monthly report to come. Factors that should be listed in weekly reports are the number of new clients acquired that week, the weekly revenue generated, comparing weekly figures, and the phase of clients present in the pipeline.
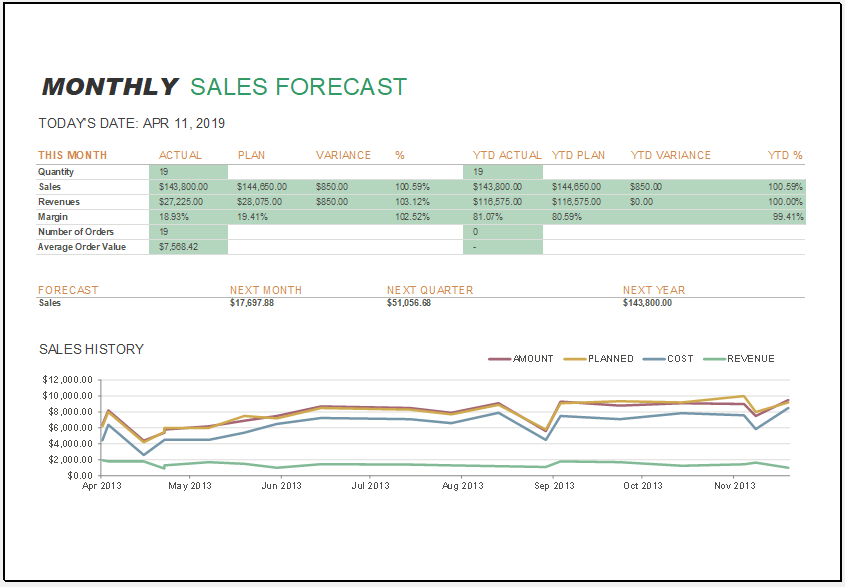
Monthly sales report: Monthly reports generally present a broader perspective of sales activity undergone throughout the month. It evaluates the sales representative’s quality performance and rates the top performer by the end of the month. These reports provide a clear picture of the expectations for the next quarter. Factors considered in the monthly reports are the number of contracts closed, the number of deals closed, and the number of projects moved up the pipeline.
- Random Team Generator
- Paint Coverage Calculator
- AI Shelf Label Generator
- Hall Pass Generator
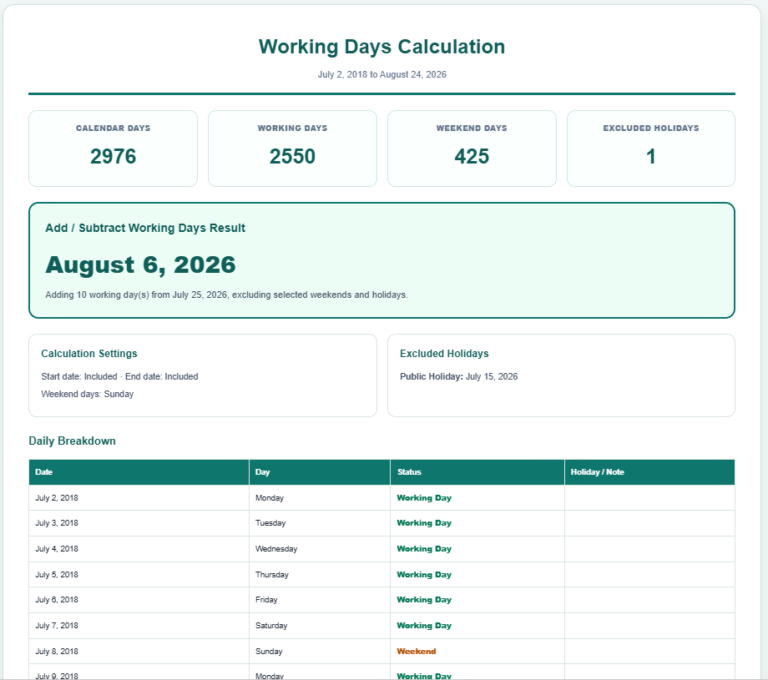
- AI Working Days Calculator
- Seating Arrangement Generator
- Donation Receipt Generator
- Decision Wheel Generator
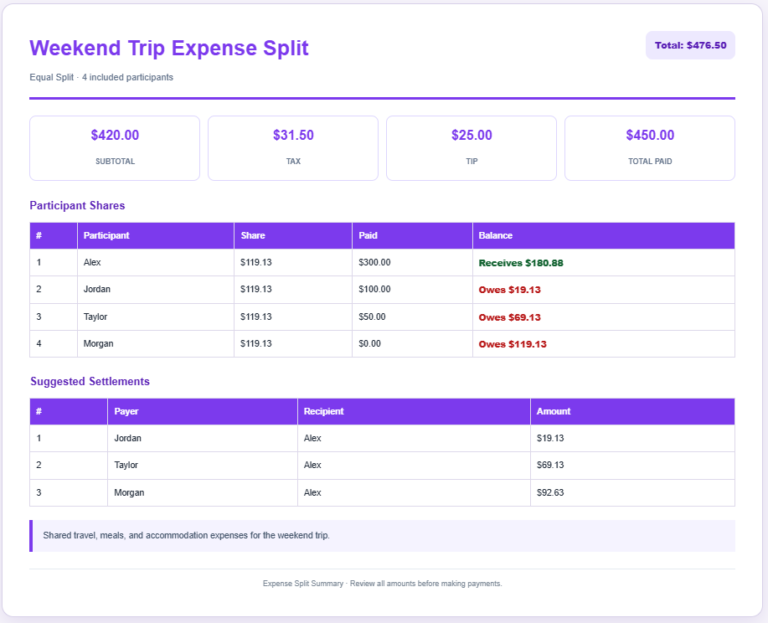
- Expense Split Calculator
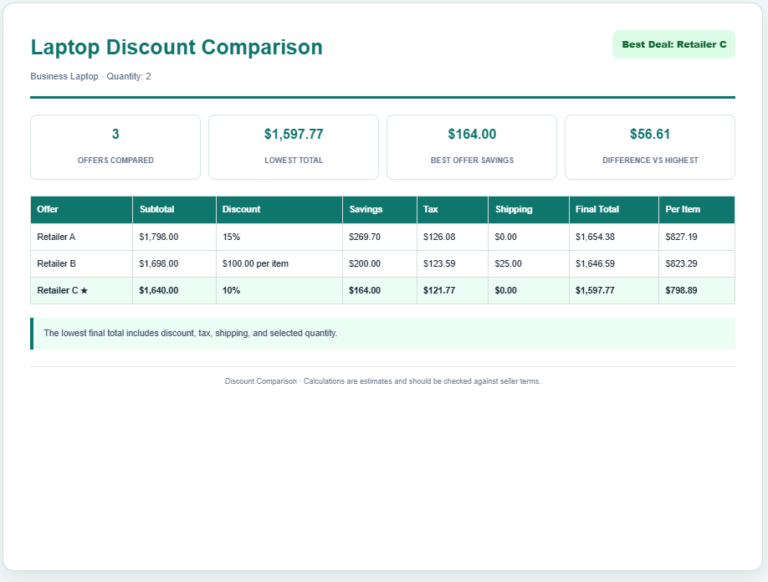
- Discount Comparison Calculator
- Appointment Slot Generator
- Cooking Measurement Converter
- Office Door Sign Generator
- Warehouse Bin Location Generator
- Dispatch Slip Generator