The Milestone Chart emerges as a guiding star, illuminating the path to success. This indispensable tool has become a linchpin in the project manager’s toolkit, aiding in efficient planning, tracking progress, and celebrating victories along the way.
In this exploration, we delve into the intricate landscape of Milestone Charts, deciphering what they are, who benefits from them, and the myriad advantages they bring to the table.
What is a Milestone Chart?
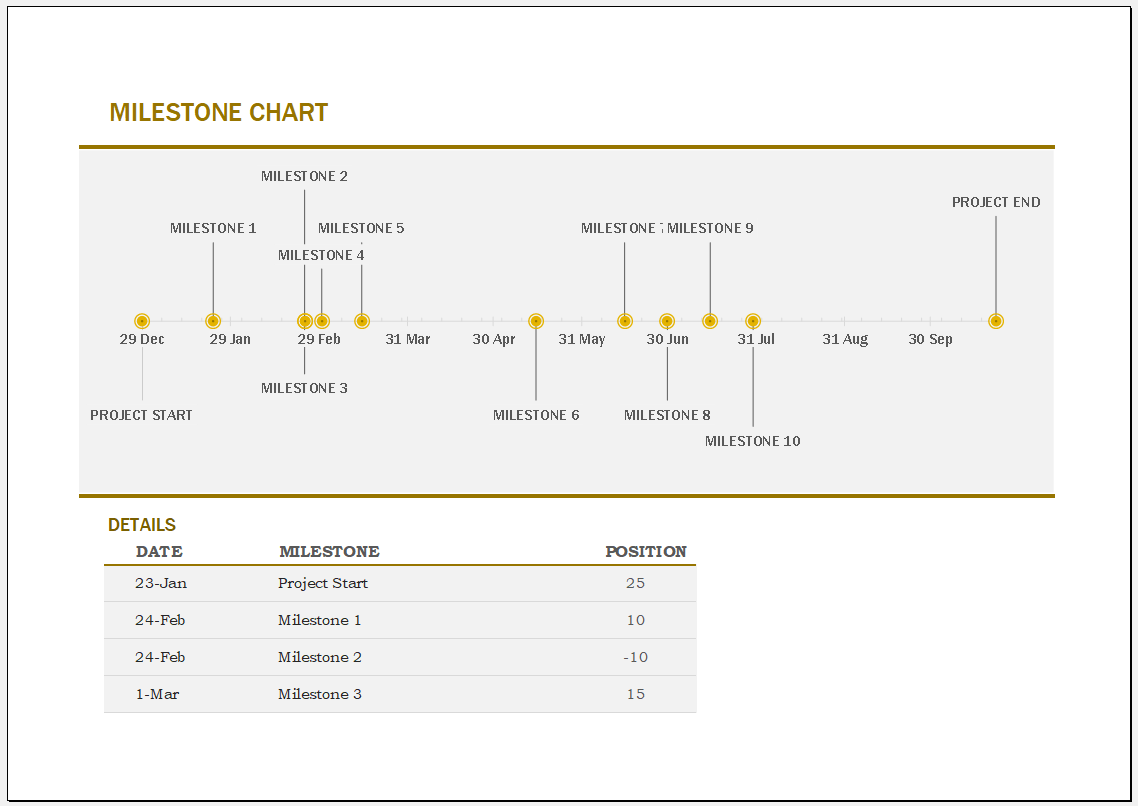
A Milestone Chart is a visual representation of key events or milestones plotted against a timeline. Unlike complex Gantt charts that detail task dependencies and durations, a Milestone Chart distills the project’s crucial moments into clear, digestible markers.
These milestones highlight significant achievements, deadlines, or the completion of pivotal project phases. Milestone Charts present a snapshot of the project’s progress, offering stakeholders a glance at where the project stands and where it’s headed.
They provide a bird’s-eye view of the journey, making it easier for teams to stay on track and stakeholders to stay informed.
Who Uses a Milestone Chart?
The beauty of the Milestone Chart lies in its versatility, making it a cherished tool across diverse industries. Project managers, team leads, and executives find immense value in its simplicity and effectiveness.
Whether you’re steering a software development project, orchestrating a marketing campaign, or managing the construction of a skyscraper, Milestone Charts transcend industry boundaries. Team members also benefit from Milestone Charts, as these visual aids offer clarity on project objectives and timelines. By providing a shared understanding of the project’s trajectory, Milestone Charts foster collaboration and alignment among team members.
What are the Benefits of Using a Milestone Chart?
Read the benefits given below…
Clarity and Focus
Milestone Charts distill complex projects into manageable components, offering a roadmap with clear markers. This clarity helps teams stay focused on immediate goals and understand the bigger picture.
Communication and Collaboration
A Milestone Chart serves as a universal language for project progress. It bridges communication gaps, ensuring that everyone – from executives to team members – is on the same page. This transparency fosters collaboration and a shared sense of purpose.
Risk Management
By highlighting critical junctures, Milestone Charts enable proactive risk management. Teams can identify potential challenges early on, allowing for strategic adjustments and mitigations to keep the project on course.
Motivation and Celebration
Milestones, by definition, mark achievements. Incorporating them into a visual representation provides tangible evidence of progress. This not only motivates the team but also offers opportunities for celebration, reinforcing a positive project culture.
Time Management
Efficient time management is the cornerstone of project success. Milestone Charts facilitate a granular understanding of project timelines, aiding in realistic scheduling and resource allocation.
How to Create a Milestone Chart?
A few steps to know before you can create a great milestone chart
Select a Suitable Tool
Choose a tool that aligns with your team’s preferences and the project’s requirements. Popular options include project management software, spreadsheet applications, or specialized milestone chart tools.
Identify Milestones
Break down the project into phases and pinpoint the milestones that denote significant achievements or completion of key tasks. These could include project kickoff, prototype development, testing phases, and project completion.
Determine Timeline
Establish a realistic timeline for your project. Define start and end dates, and allocate timeframes for each milestone. Ensure that the timeline aligns with the project’s overarching goals and constraints.
Plot Milestones on the Chart
Once you have your milestones and timeline in place, it’s time to plot them on the chart. Use a graphical representation that suits your team’s preferences, whether it’s a simple timeline or a more detailed Gantt chart.
Template

File: MS Excel (.xlsx)
Size: 98 KB
- Universal Work Order Generator
- Office Asset Transfer Form Generator
- Summer Holiday Assignment Cover Page Generator
- Salary and Overtime Calculator Template
- Summer Vacation Planner Generator
- Outlet Mall Shopping Planner
- Customer Information and Ranking Sheet
- Small Family Kitchen Design Planning Sheet
- Summer Party Budget Sheet Generator
- Payroll Register & Salary Sheet Generator
- Employee Skill Development Tracker
- HR Budget & Expense Tracker
- Leave & Vacation Tracker
- Exit/Off-boarding Checklist
- Performance Evaluation Sheet