Graph paper is used for many purposes, including drawing graphs, creating patterns, designing maps and solving mathematical problems. It is commonly used to plot points and draw geometric shapes.
Standard graph paper is divided into small squares, and each square represents one unit on both the x-axis and the y-axis. The grid lines guide you in plotting points. There are many types of graph paper, including pentagon graph paper.
What is pentagon graph paper?
Pentagon graph paper is made of pentagons, which are shapes with five sides and five angles. Our version uses rings of regular pentagons, one inside the other, with five axes running from the centre to the corners. This layout is also known as radar or spider chart paper. You can choose the number of rings, the value of each ring and the paper size.
Pentagon Graph Paper Generator
Make pentagon (radar or spider) graph paper in the size you need. Choose the rings and the scale, pick the lines and labels, and print one or more charts on each page.
Page
Page Heading
Rings & Scale
Lines & Marks
Axis Labels
Axes are numbered clockwise from the first corner. Leave a label empty to print a blank corner.
Plot Your Data
Each series needs one value for each of the five axes. Values are drawn against the scale (rings × value of each ring). Leave plotting off to print blank paper.
Data Series
What is pentagon graph paper used for?
It is used to plot data that has five categories, such as skills, scores or survey results, and to compare several sets of data on the same chart. It is also useful for geometry lessons, where students study the pentagon, its corners, its symmetry and its star (pentagram) lines, and for design sketches and craft projects.
How to make pentagon graph paper?
The paper you need depends on the task. Here are some tips:
Choose the number of rings and the scale:
Each ring is one step on the scale. For example, 10 rings with a value of 1 each give a scale from 0 to 10. Fewer rings keep the paper simple, while more rings let you plot more precisely.
Keep the pentagon regular:
In a regular pentagon, all sides are the same length and all angles are equal. Each pentagon has five corners, called vertices, where the sides meet. The five axes should be evenly spaced, so that each one is 72 degrees from the next.
Keep it simple:
Use only the lines you need. Too many lines, dots or colours can make the paper harder to read and lead to mistakes. A thicker line on every fifth ring helps you count the rings quickly.
Make it accurate:
The rings must be drawn evenly and the axes neatly aligned, so the points you plot are in the right place. Printing from a generator keeps the shapes exact.
Uses
Pentagon graph paper is helpful for activities that need five categories to be compared at a glance. It can also be used for decorative designs and craft projects.
Graphs are a useful way to show relationships in data. With graph paper, complex information can be presented clearly and neatly in a small space, which makes it easier to understand.
Create your own pentagon graph paper with our generator. Choose the paper size, the number of rings, the lines and the labels, put up to six charts on a page, and print it or save it as a PDF. You can also enter your data to plot it on the pentagon, and download an Excel file with the totals and averages worked out for you.
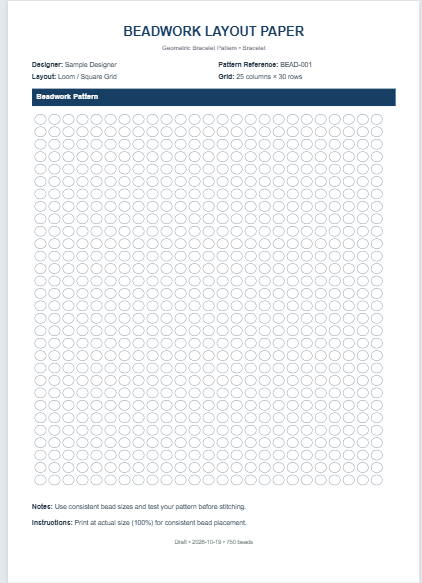
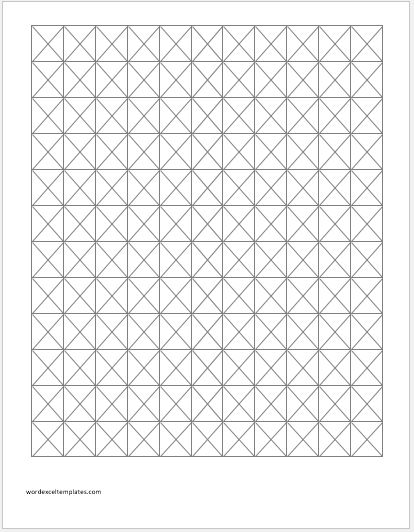
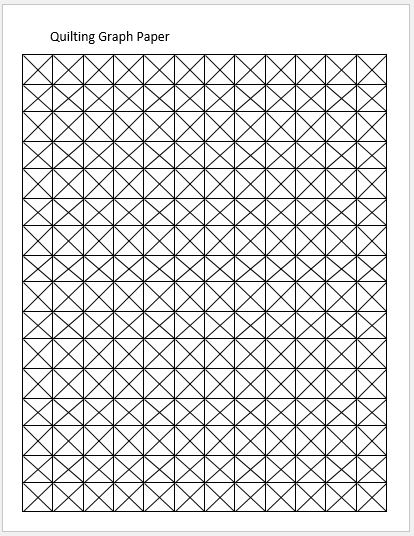
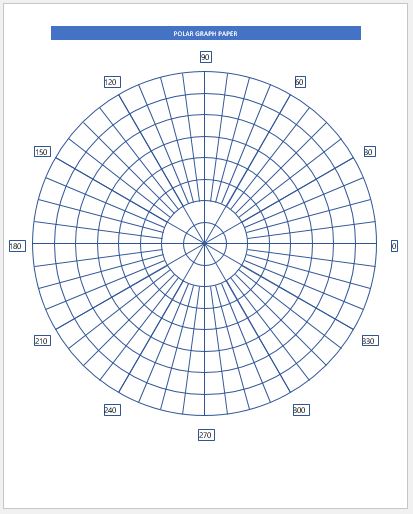
The following are given various pentagon graph papers for MS Word format.
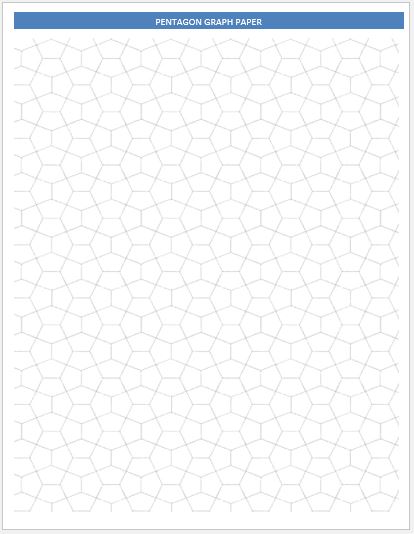
File: PNG -Size 22 KB
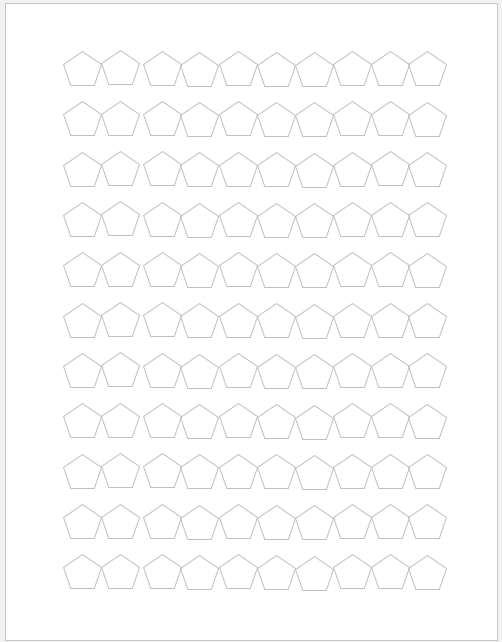
File: PNG -Size 34 KB
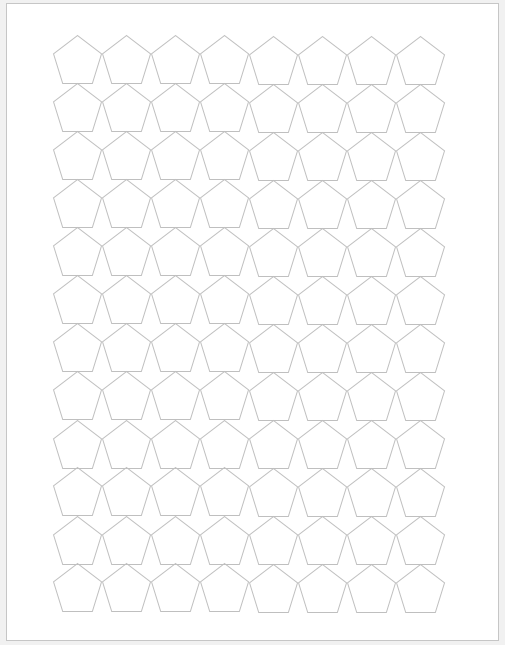
File: PNG -Size 31 KB