The unit circle is a circle with a radius of one. It is used in mathematics, especially in trigonometry. It is centered at the origin (0, 0) of the coordinate system. The unit circle makes it much easier to learn and understand angles and lengths.
The unit circle works by relating the angles of a right triangle to the lengths of its sides. When a student learns about the unit circle for the first time, this chart helps them understand the concept properly. Students and teachers use it not only to learn but also to understand the trigonometric functions of special angles such as 30°, 45°, 60° and 90°, and the angles that correspond to them in the other quadrants. The unit circle is also important for modeling periodic phenomena, among other uses.
Create your unit circle chart below:
Unit Circle Chart Generator
Make a unit circle chart with the special angles. Print a full chart to study from, or a blank worksheet for practice with an answer key.
Page
What the Chart Shows
Practice Worksheet
Blank spaces are drawn as lines to write on. The answer key is only printed when something is left blank.
Reference Page
The reference page has a table of the special angles with cos, sin and tan, the sign rules (All Students Take Calculus), the main identities and the two special triangles.
Excel
The Excel file lists the angles with the cosine, sine and tangent worked out by formulas, plus the quadrant and the reference angle. You can type any other angle in degrees in the first column and the values will update.
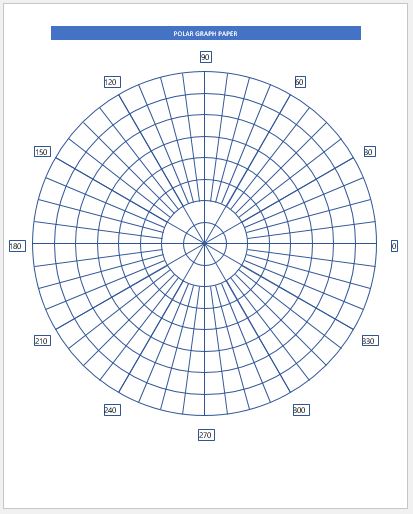
A unit circle chart helps students in many ways. It lets them draw a unit circle quickly, and it can be drawn on a plain sheet of paper or on graph paper. A unit circle chart is a circle divided into four quarters by two lines, one horizontal and one vertical. The ends of the lines are labeled 0, π/2, π and 3π/2, starting from the right end and moving anticlockwise. A full turn brings you back to the starting point, which is 2π (360°).
Each quarter has three more lines, and the point where each line meets the circle is labeled with its angle. For example, the first quarter has π/6, π/4 and π/3. These radian values can be worked out from the degrees by multiplying by π/180.
Next to the circle, the chart usually has a table. The first column lists the angles in degrees, and the other columns give the radians and the values of cosine, sine and tangent for each angle.